Find useful activity in Signals & Insights
Find useful activity in Signals & Insights
Open Insights to see recent activity from companies and people your team follows. Start here when you want to know who has been active and what to look at next.
A signal is a recorded activity, such as a website visit or an ad click. It gives you a reason to review an account; it does not by itself confirm that someone wants to buy.
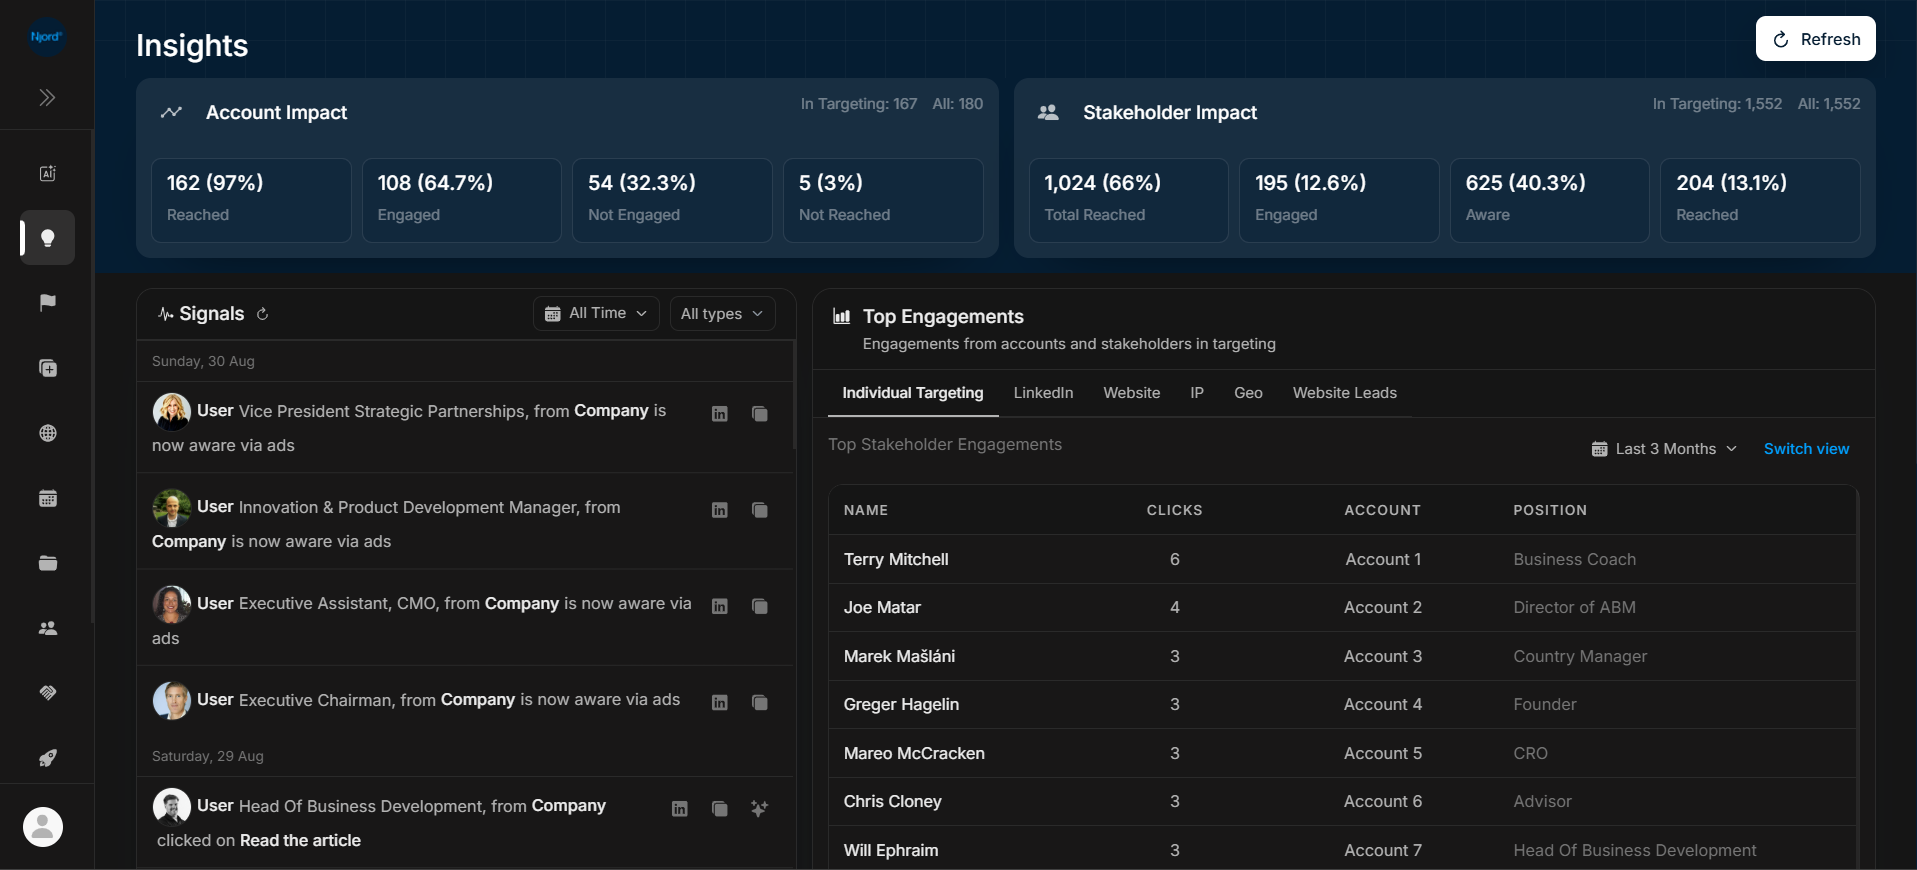
Image guide: Impact cards summarize activity at the top. Signals lists recent events on the left, while Top Engagements highlights active accounts or people on the right.
Start with one question
| What you want to know | Open this guide |
|---|---|
| What happened recently? | Read and filter the Signals feed |
| Which accounts or people are most active? | Use Top Engagements |
| How many accounts or people have been reached? | Understand the Impact cards |
| Which industries or groups are in our account list? | Explore account breakdowns |
| Which companies visited our website? | Review Website Leads |
Review recent activity
- Confirm whether you are viewing My data or Workspace. Learn how the data menu works.
- Read the recent Signals and narrow the date or signal type if needed.
- Select an account or stakeholder to see the surrounding activity.
- Check existing deals, meetings and notes before deciding on a follow-up.
If you need help interpreting an event, use the available Njord AI action on a signal.
Continue From The Summary
When the compact Signals summary is shown, select Engaged to open the stakeholder engagement report or Website visits to open Website Performance. DOE carries the current duration into the report so you can review the rows behind the number.
Understand the different views
Signals shows individual events. Top Engagements helps you compare activity. Reports lets you inspect detailed records behind performance numbers.
For example, a website visit can lead you to a company in Website, where you can review the pages visited. To compare website performance across target accounts, open the Website Performance report.
If the page looks empty or numbers differ
Check the date range, active filters and selected data view. Account totals count companies; stakeholder totals count people, so they answer different questions.
See compare personal and team Insights for the checks to make before comparing with a teammate.