Identified traffic dashboard
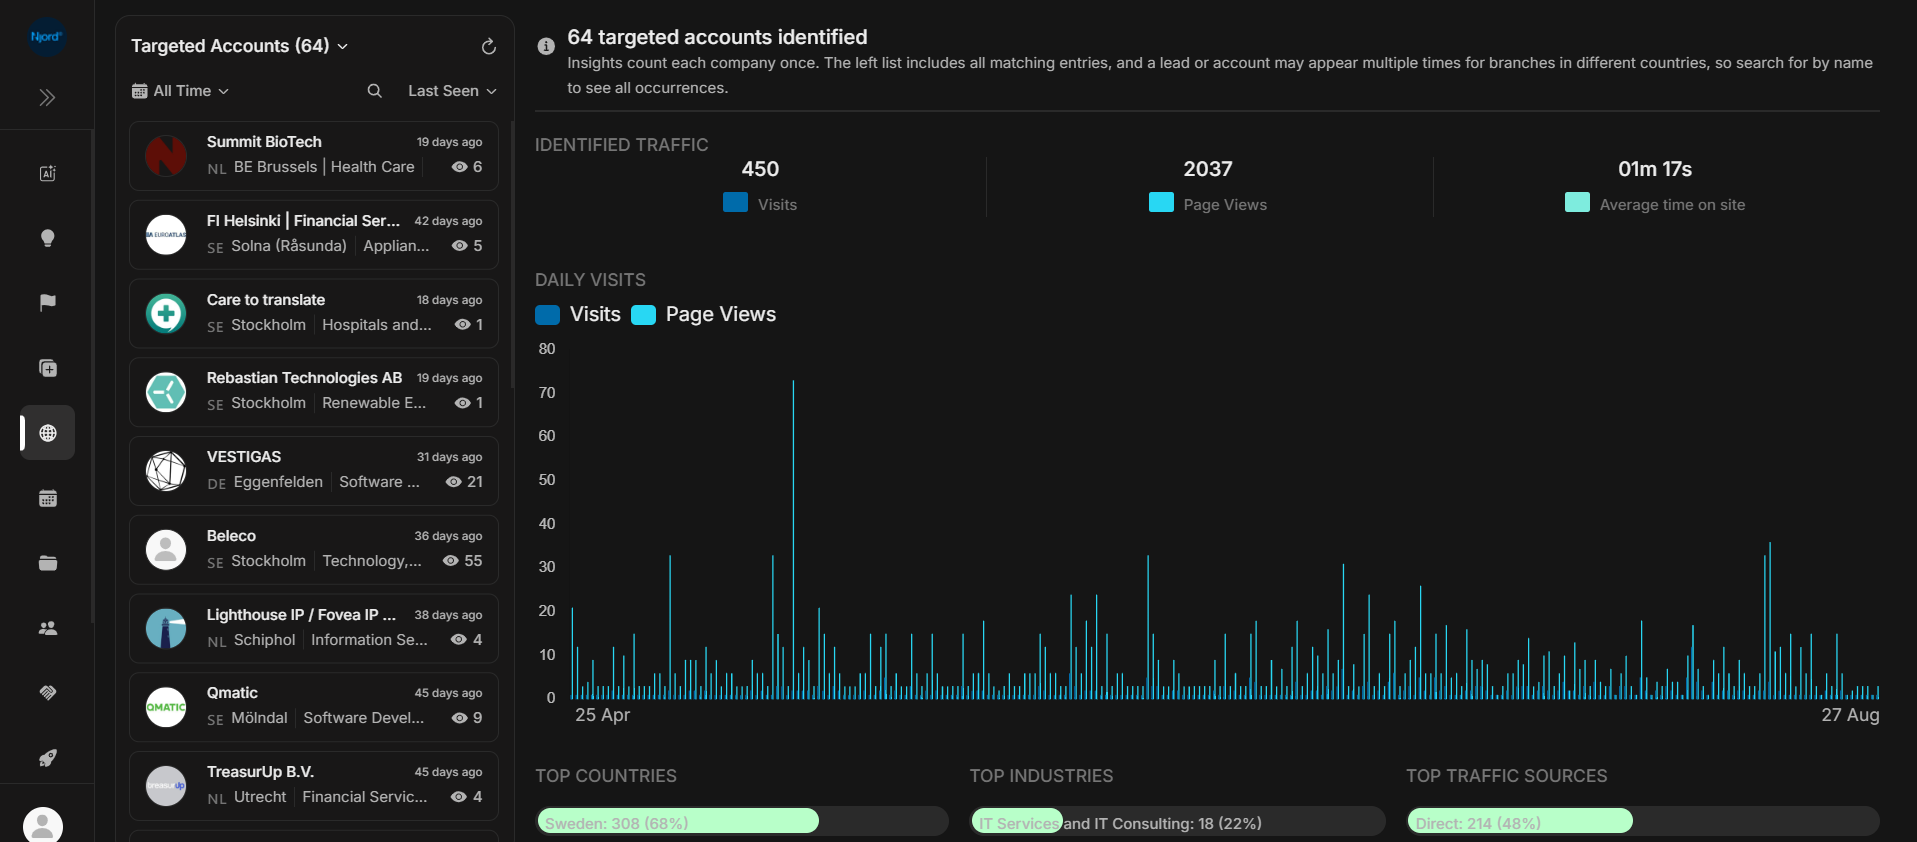
Identified traffic dashboard
The Identified Traffic dashboard is the right side of the Website page when no company detail is selected. It summarizes the traffic DOE can connect to named companies for the selected account type and date period.
Where it sits in DOE: Website > Identified Traffic.
Image guide: All Accounts combines targeted and non-targeted identified traffic. Use it to understand overall named company activity before drilling into one company.
Use This Dashboard To
| Need | How the dashboard helps |
|---|---|
| Understand website interest volume | Review visits, page views, and average time on site. |
| Compare targeted and non-targeted traffic | Switch the account type and watch the summary change. |
| Spot recent spikes | Read the Daily Visits chart. |
| Understand geography | Review Top Countries. |
| Understand market fit | Review Top Industries. |
| Understand acquisition source | Review Top Traffic Sources. |
Summary Metrics
| Metric | Meaning |
|---|---|
| Companies identified | Number of companies counted once in the selected scope. |
| Visits | Website sessions DOE connects to identified companies. |
| Page Views | Tracked pages viewed during those visits. |
| Average time on site | Average visit duration when timing data is available. A dash means DOE cannot show a useful value. |
The heading changes based on the selected account type:
| Selected type | Heading meaning |
|---|---|
| Targeted Accounts | Identified target accounts only. |
| Non-Targeted Accounts | Identified companies that are not currently target accounts. |
| All Accounts | Identified companies across targeted and non-targeted traffic. |
Daily Visits Chart
The chart compares visits and page views by day. Visits are sessions. Page views are the pages viewed inside those sessions. A day with low visits and high page views can still matter if one company viewed many important pages.
Use the chart to answer:
- Did activity happen recently or earlier in the period?
- Did page views increase faster than visits?
- Is one day driving most of the summary?
- Does the pattern match a campaign, event, launch, or outreach sequence?
Top Countries, Industries, And Sources
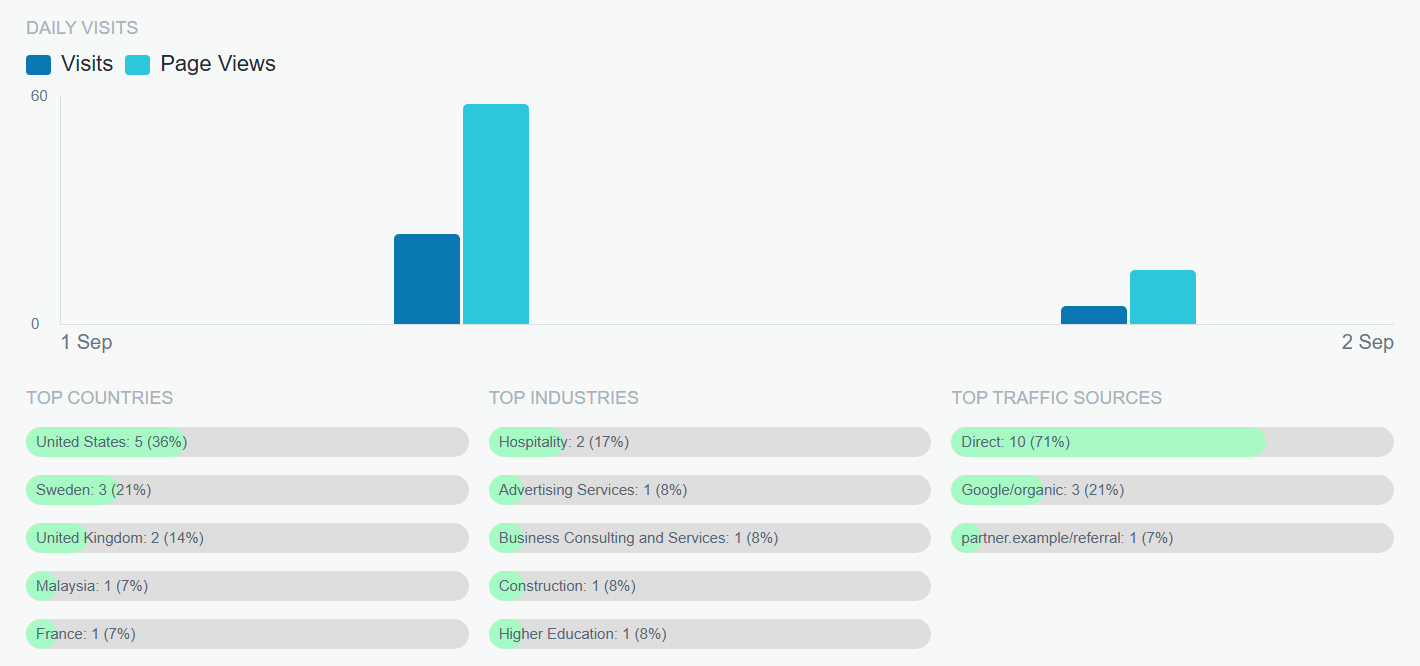
Image guide: the bottom lists show which countries, industries, and traffic sources contributed the most activity. Use Show More only when the first few rows are not enough.
| Breakdown | What it tells you | How to use it |
|---|---|---|
| Top Countries | Where identified activity is coming from. | Check whether traffic matches target markets. |
| Top Industries | Which company categories are showing activity. | Check whether traffic matches ideal customer profiles. |
| Top Traffic Sources | How identified visitors arrived, such as Direct, organic search, referral, or campaigns. | Understand whether traffic is owned, paid, organic, or referral-driven. |
Percentages are based on the selected view and period. They are not universal benchmarks.
Targeted And Non-Targeted Examples
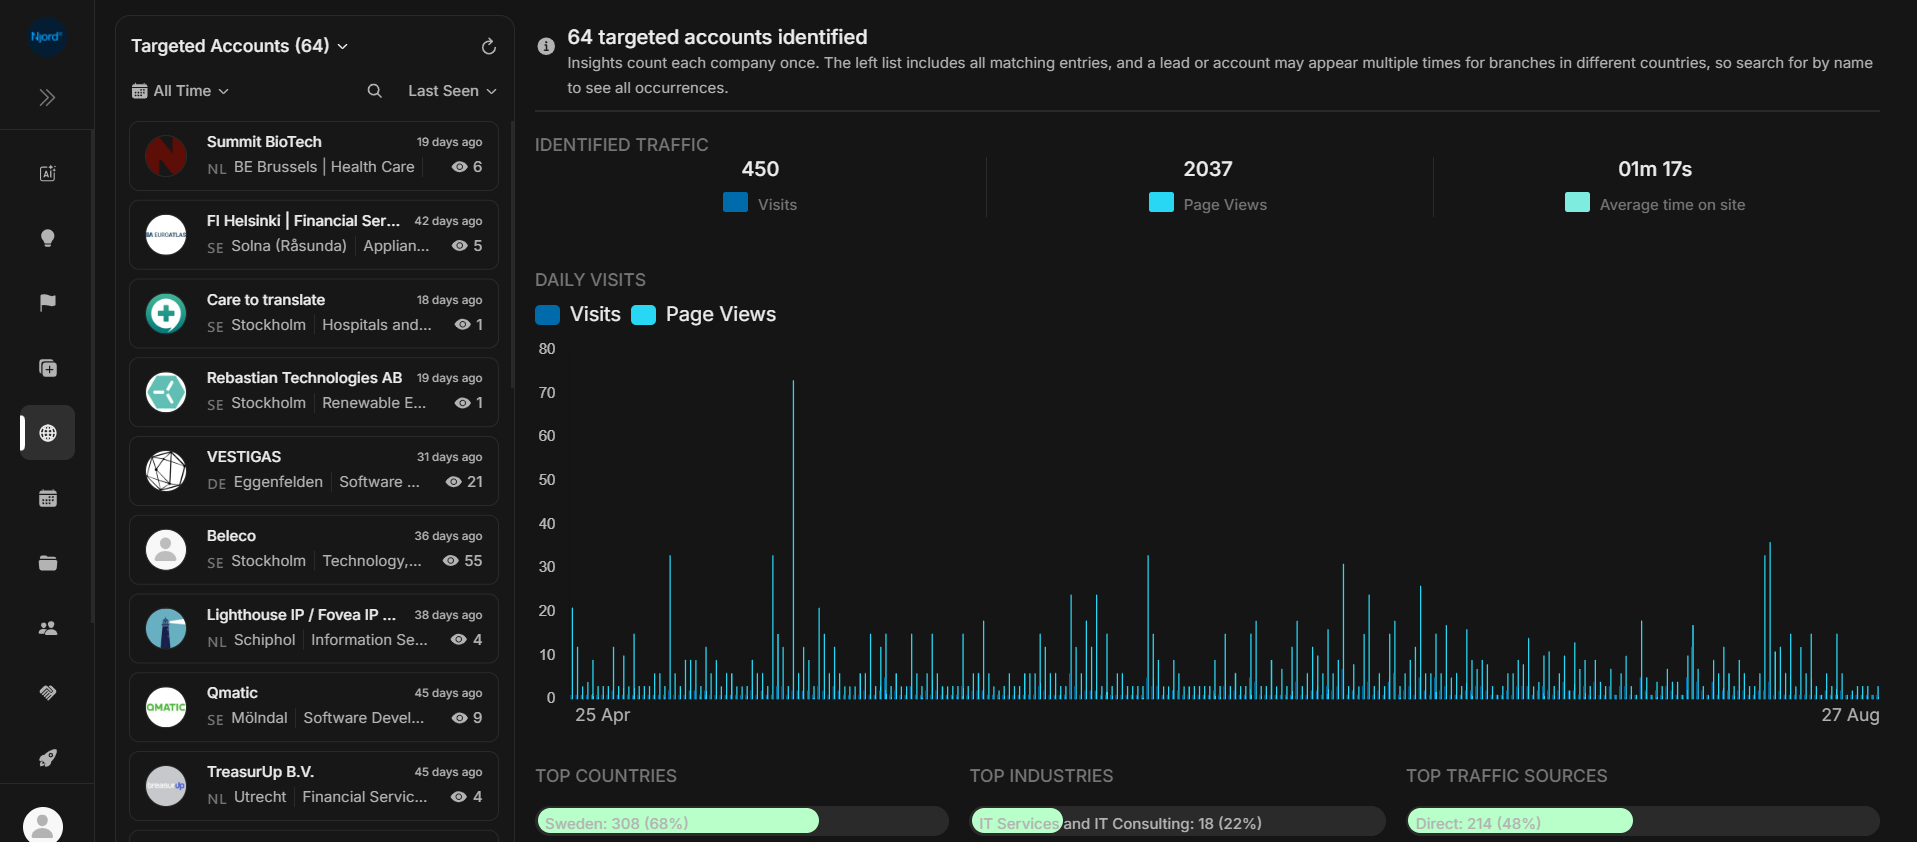
Image guide: Targeted Accounts focuses on known account interest. Use this for account-owner review.
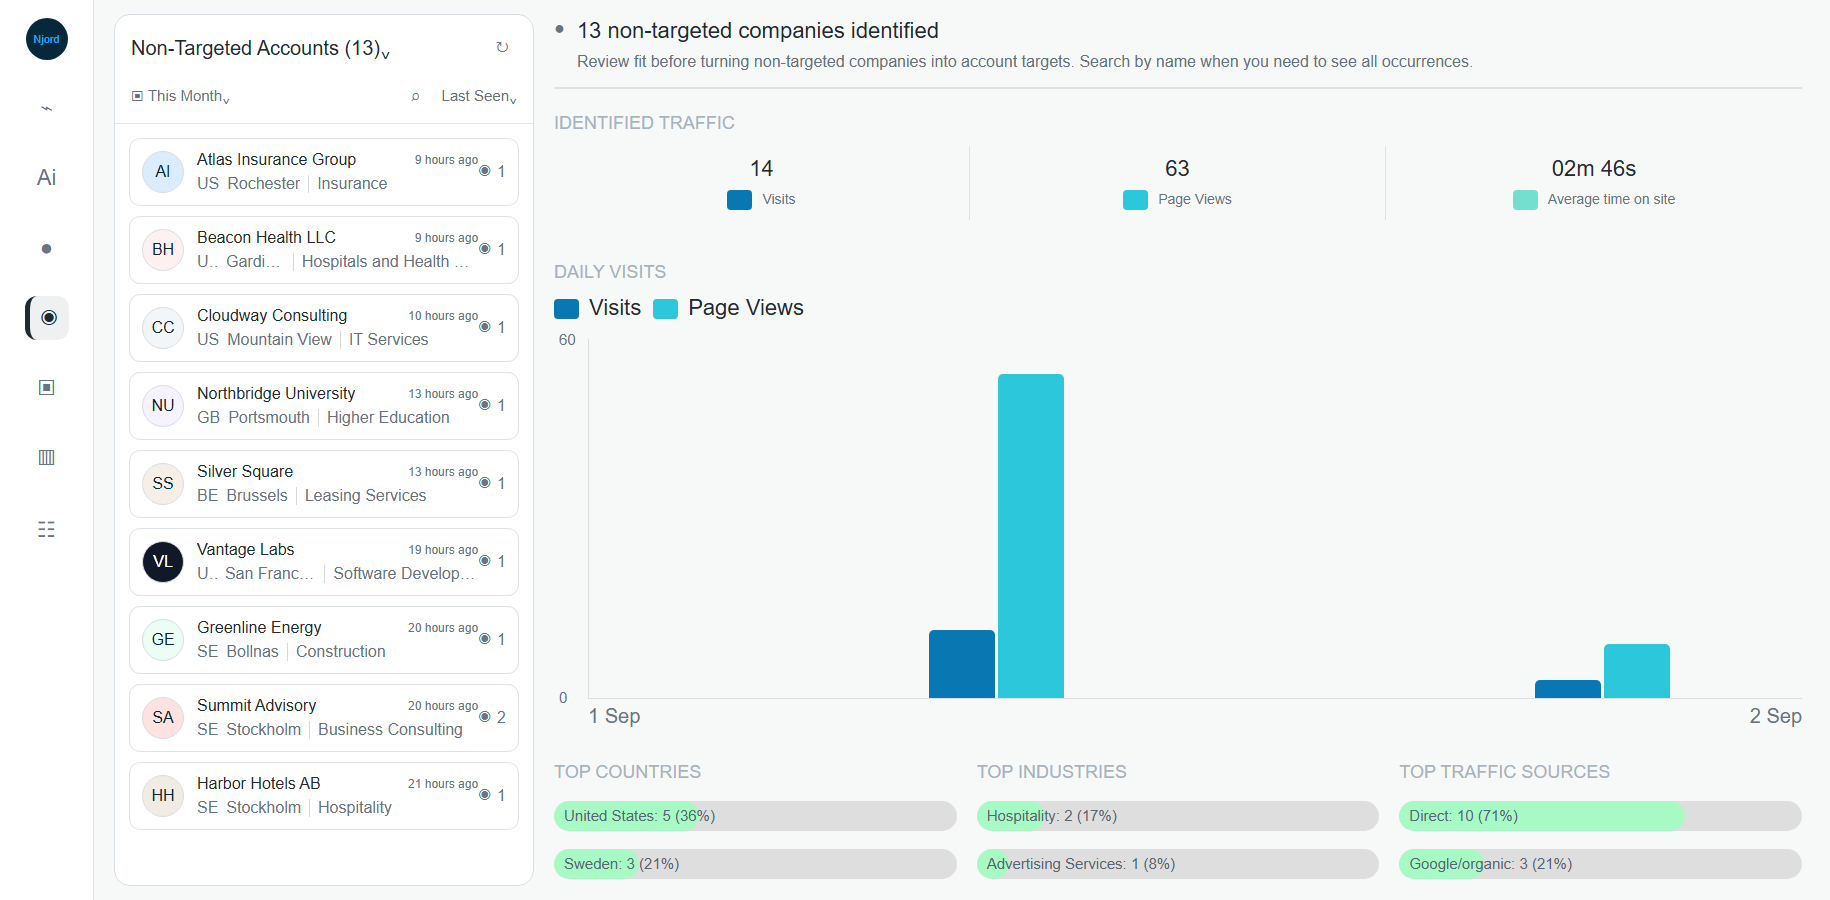
Image guide: Non-Targeted Accounts focuses on discovery. Review fit before turning a visitor into a target account.
If The Dashboard Looks Empty
| What you see | What it usually means | What to do |
|---|---|---|
| No chart | There are no daily records for the selected scope. | Widen the period or switch account type. |
| No top lists | DOE does not have enough grouped country, industry, or source data. | Use the company list and visit detail instead. |
| Dash for average time | Timing data is missing or not useful. | Use visits, page views, and page paths. |
| Counts changed after switching type | You changed the targeted/non-targeted scope. | Compare one scope at a time. |
Good Review Pattern
- Start with All Accounts to understand overall identified traffic.
- Switch to Targeted Accounts to see known-account intent.
- Switch to Non-Targeted Accounts to find discovery candidates.
- Open the most important companies and inspect their page paths before taking action.