Period Comparison
Period Comparison
Period Comparison compares the current selected period with the previous equivalent period for Media Analytics channels. Use it to explain increases, decreases, and unavailable comparisons.
Where it sits in DOE: Reports > Targeted Accounts > Media Analytics > Period Comparison.
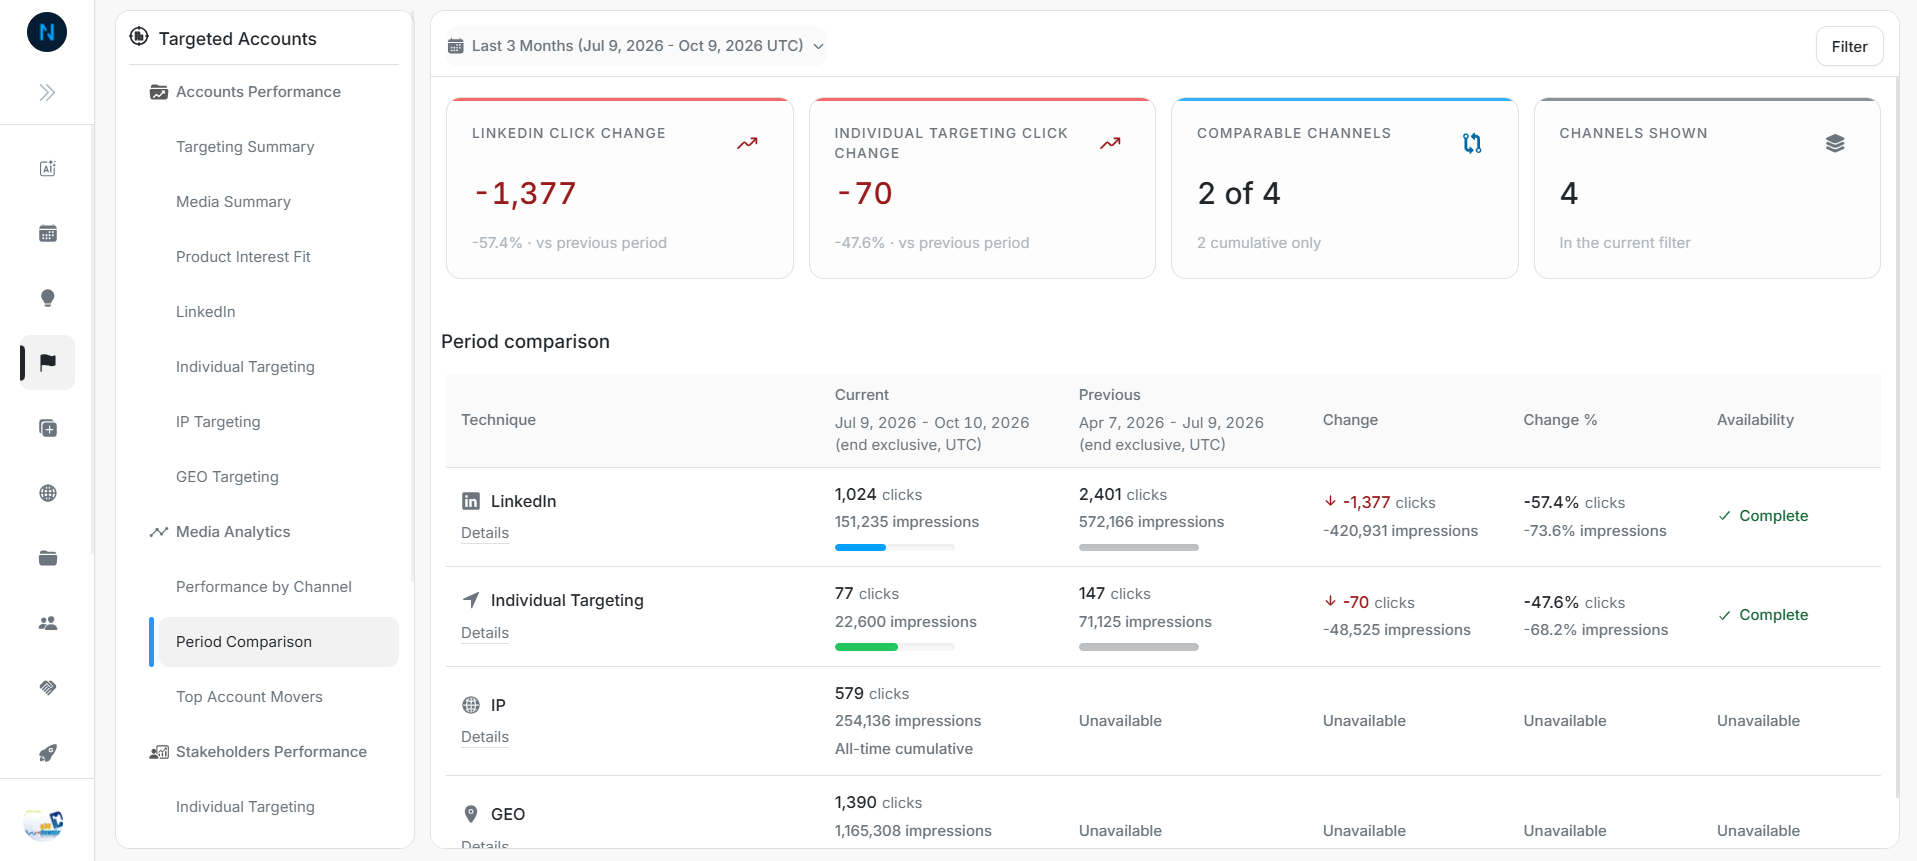
Image guide: the top cards summarize major click changes, comparable channels, and channels shown. The table compares current and previous values by technique.
Main Columns
| Column | Meaning |
|---|---|
| Technique | The channel or technique being compared. |
| Current | Clicks and impressions in the current selected period. |
| Previous | Clicks and impressions in the previous equivalent period. |
| Change | Absolute click and impression change. |
| Change % | Percentage change for clicks and impressions. |
| Availability | Whether DOE can complete the comparison for that row. |
Review Comparable Rows
Rows such as LinkedIn and Individual Targeting can show current values, previous values, absolute change, percentage change, and Complete availability when DOE has both periods.
Use Details when a row needs context about scope, cohort basis, or why a comparison is unavailable.
Understand Unavailable Rows
Some channels can show current cumulative values but cannot provide historical period comparison.
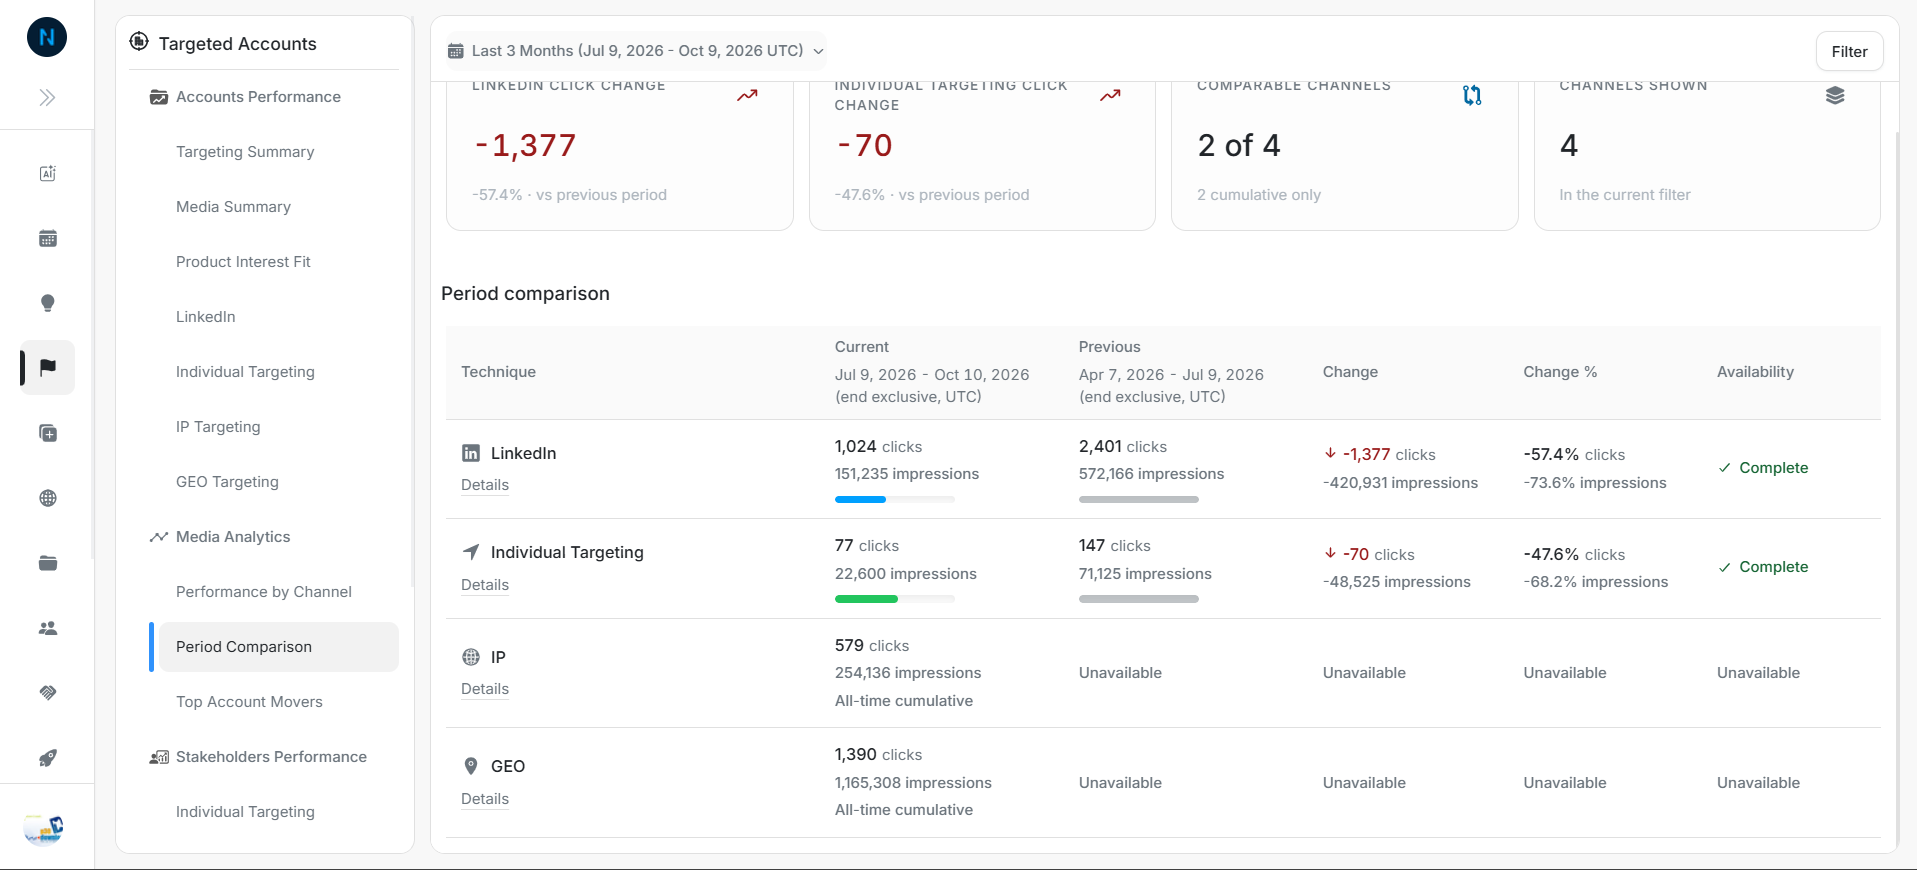
Image guide: IP and GEO can show current cumulative values while previous period, change, and change percentage remain unavailable.
Review Order
- Confirm the current and previous period labels in the table header.
- Check Comparable Channels before expecting every visible channel to compare.
- Review completed rows first.
- Open Details for rows with surprising movement or unavailable status.
- Move to Top Account Movers when you need account-level evidence behind a channel change.
How To Interpret Change
A negative change means the current period is lower than the previous period. A positive change means the current period is higher. Compare both clicks and impressions before deciding whether the movement reflects engagement quality, delivery volume, or both.
If It Does Not Look Right
Match the same date range as Performance by Channel. If IP or GEO is unavailable for comparison, use the current cumulative values as context but do not treat them as period-over-period evidence.